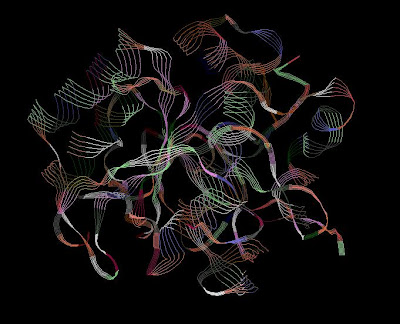
Our assignment is to download certain models of molecules from the PDB (Protein Database) website. Then, we are to edit those models and to paste it here in our blogspot.
These are the results that we manage to obtain:
| Name of Molecules | Editing Details (Display, Colour) | Image of Molecules |
|---|---|---|
| Collagenase | Ball & Stick, Temperature |  |
| Subtilisin | Strands, Shapely |  |
| Kexin | Spacefill, Chain |  |
| Signal Peptidase | Backbone, Structure |  |
That is all from today. Again, we deeply thank Madam Linda for teaching us on how to use this software. May this knowledge benefit us in our near future.
Assalamualaikum..

No comments:
Post a Comment